



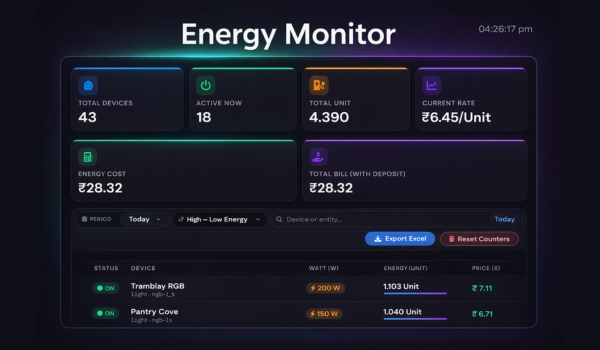
Key Features of the Dashboard
1. Real-Time Device Monitoring
Stay updated with all connected loads across your premises:
This helps you instantly identify which circuits are drawing power at any second.
2. Energy Consumption Insights
The dashboard displays clear breakdown metrics:
- Total Units Consumed: 4.390 kWh Units today.
- Device-wise Watt Usage: Granular live power draws (e.g., Geyser: 2000W, HVAC: 1500W, Lighting: 150W).
- Runtime Tracking: Cumulative operating hours for compressors and heavy motors.
3. Cost Calculation in Real-Time
No more guessing your monthly utility bill:
• Current Tariff Rate: ₹6.45 / unit
• Calculated Energy Cost: ₹28.32
• Estimated Monthly Projection: Instant translation of usage into financial savings.
4. Smart Filtering & Sorting
Analyze your power data efficiently with customizable period filters (Today / Weekly / Monthly / Custom range), one-click sorting (Highest → Lowest energy consumption), and search bar filtering by device name or room zone.
5. Export & Control Options
Export audit-ready CSV/Excel reports for commercial LEED compliance, reset counters for fresh load testing, and refresh live telemetry instantly across the network.
Why This Dashboard Matters
Better Decision Making
Identify energy-hungry devices and eliminate unnecessary standby power consumption.
Direct Cost Savings
Track, schedule, and optimize your electricity consumption during peak tariff periods to lower bills.
Real-Time Visibility
Zero reporting delays—see instantaneous kilowatt draws and voltage fluctuations immediately.
Scalable Solution
Deploys seamlessly across single residential apartments, multi-story luxury villas, IT parks, and factories.
Practical Use Cases
🏠 Smart Homes & Villas
Monitor HVAC, pool pumps, and solar inverter generation with automated load shedding.
🏢 Commercial Offices
Sub-metering by floor or department with automated lighting shut-off post working hours.
🏭 Industrial Facilities
Phase voltage monitoring, three-phase load balancing, and predictive motor maintenance.
⚙️ IoT Automation Systems
Automated rules to trigger alerts when power draw exceeds safety thresholds.
Conclusion
The Energy Monitoring Dashboard transforms complex electrical data into simple, actionable insights. With real-time tracking, cost analysis, and smart controls, it empowers users to take full control of their energy footprint.